
How to perform land cover classification using image segmentation in Python?
- Jun 28, 2015
- 2 min read
Here is the challenge: How can you extract a river, with a high degree of accuracy, from a 4-band NAIP image? Two broad classes of approaches exist--object oriented or pixel based--for tackling this kind of image classification problem. One of the most simple approaches is called "image thresholding" where you simply assign pixel values above or below a certain threshold a value of 1 and all other values a value of 0. This is a handy method to know, although there are several drawbacks including decreased accuracy, pixel confusion, and "salt and pepper" effects.
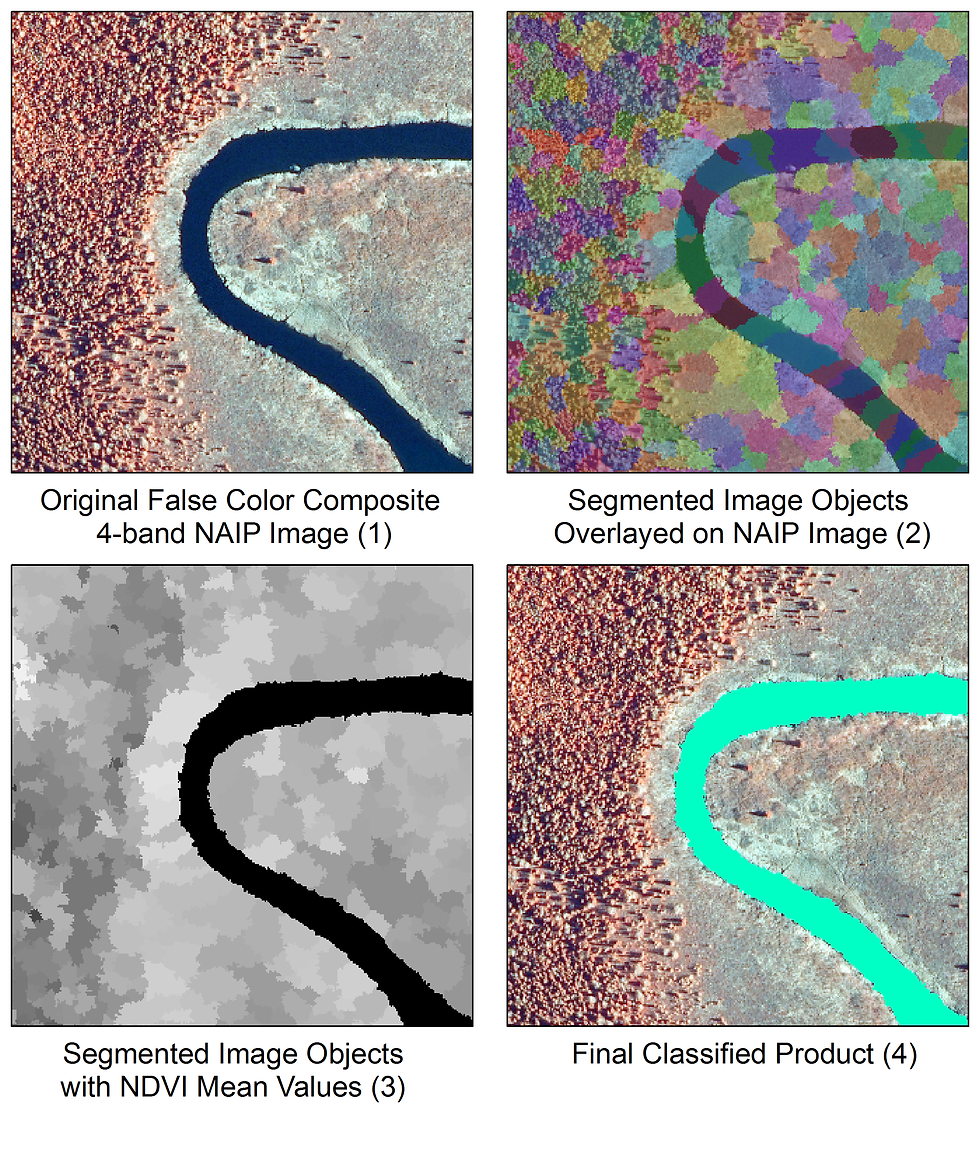
A powerful alternative to pixel-based approaches is image segmentation and classification, which is an object oriented image analysis technique. Image segmentation algorithms work by grouping similar pixels based on statistical characteristics. In this example we use both the scikit-image and the arcpy (ArcGIS) packages. I hope to port the arcpy functions over to GDAL in the future, however, for convenience sake I will be doing some of the GIS work using the arcpy package. The following is the workflow to extract a river from a 4-band NAIP image (Image 1) using image segmentation techniques.
1) Convert image to a numpy array
2) Perform a quick shift segmentation (Image 2)
3) Extract coordinates from NAIP bounding box
4) Convert numpy array to raster
5) Calculate NDVI
6) Extract mean NDVI values within each image object zone (Image 3)
7) Classify the NDVI image objects (Image 4)
#####################################################
from __future__ import print_function
import arcpy
arcpy.CheckOutExtension("Spatial")
import matplotlib.pyplot as plt
import numpy as np
from skimage import io
from skimage.segmentation import quickshift
# The input 4-band NAIP image
river = r'C:\path\to\naip_image.tif'
# Convert image to numpy array
img = io.imread(river)
# Run the quick shift segmentation
segments = quickshift(img, kernel_size=3, convert2lab=False, max_dist=6, ratio=0.5)
print("Quickshift number of segments: %d" % len(np.unique(segments)))
# View the segments via Python
plt.imshow(segments)
# Get raster metrics for coordinate info
myRaster = arcpy.sa.Raster(river)
# Lower left coordinate of block (in map units)
mx = myRaster.extent.XMin
my = myRaster.extent.YMin
sr = myRaster.spatialReference
# Note the use of arcpy to convert numpy array to raster
seg = arcpy.NumPyArrayToRaster(segments, arcpy.Point(mx, my),
myRaster.meanCellWidth,
myRaster.meanCellHeight)
outRaster = r'C:\path\to\segments.tif'
seg_temp = seg.save(outRaster)
arcpy.DefineProjection_management(outRaster, sr)
# Calculate NDVI from bands 4 and 3
b4 = arcpy.sa.Raster(r'C:\path\to\naip_image.tif\Band_4')
b3 = arcpy.sa.Raster(r'C:\path\to\naip_image.tif\Band_3')
ndvi = arcpy.sa.Float(b4-b3) / arcpy.sa.Float(b4+b3)
# Extract NDVI values based on image object boundaries
zones = arcpy.sa.ZonalStatistics(outRaster, "VALUE", ndvi, "MEAN")
zones.save(r'C:\path\to\zones.tif')
# Classify the segments based on NDVI values
binary = arcpy.sa.Con(zones < 20, 1, 0)
binary.save(r'C:\path\to\classified_image_objects.tif')
###################################################


Comments